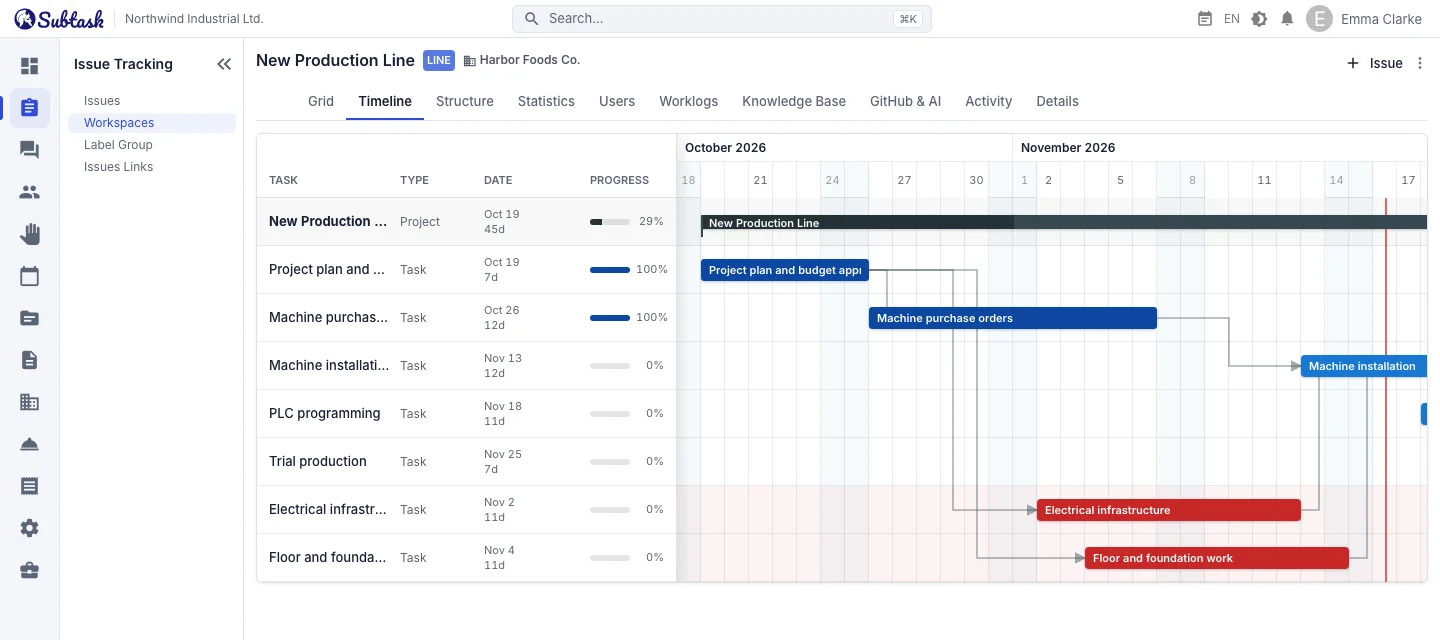
- Date bars Each task appears as a bar between its start and end dates.
- Dependencies See which tasks are waiting on others through dependency links.
- Progress Progress, estimated and logged time, and delay information.
- Mobile view A compact chart for small screens.
A workspace with a timeline model
The Gantt chart is available in workspaces created with a work model that supports timelines. In these workspaces, task forms include start date, task type and dependent tasks fields. It suits projects where the order of dates matters, such as construction, event planning, product launches, installation and commissioning.
What does the Gantt chart show?
- Date-range bars: each task is drawn between its start and end dates.
- Dependency links: if a task is waiting on other tasks, their connections appear in the chart.
- Workspace summary row: the start and end of the whole project appear at the top.
- Task information: task type, dates, progress, estimated and logged time, and delays.
- Total and completed task counts: overall project progress.
- Weekends and today marker: weekends are marked on the calendar, and a line shows today's position.
Progress is calculated using whether a task is in a completed status; completed tasks appear accordingly in the chart.
Spot delays early
Tasks that are past their due date and still open appear in Gantt with delay information. You can also find this information in the overdue tasks table and workload-per-person chart in workspace statistics. Reading these two screens together helps you understand whether a delay comes from work piling up on one person or a pending dependency.
Gantt, kanban and calendar together
The Gantt chart is a view of issue tracking; update dates and dependencies in the task form, and the chart reflects the change. Manage day-to-day work on the kanban board and open Gantt in meetings. Task deadlines also appear as a layer in the calendar; if you have enabled your personal calendar subscription, deadlines for tasks assigned to you also appear in Google Calendar or Outlook.
Example: an office relocation project
| Task | Dates | Dependency |
|---|---|---|
| New office lease | March 1–5 | — |
| Internet and electricity accounts | March 6–15 | Lease |
| Furniture order | March 6–20 | Lease |
| Moving computers | March 21–22 | Internet, furniture |
If the lease shifts by a week, the chart's arrows show immediately which tasks are affected. You can reassign the moved computers to employees in the asset assignment module.
Frequently asked questions
Is the Gantt chart free?
Can I change dates by dragging bars?
Can a task have multiple dependencies?
Can I view the Gantt chart on mobile?
Bring your team together in one place
Get started with Subtask for free, invite your team and create your first task in minutes. The price does not change with your user count.
Create a free account